Mapping Neighborhood Networks


Mapping
Neighborhood
Networks
Exploring
the Chicago
Community
Networks
Data Set
Community-based organizations and other local actors charged with improving neighborhoods are part of larger networks of local institutions that encompass different types of formal and informal partnerships. The features of the networks themselves, not just the individual organizations within them, may affect communities' abilities to improve local conditions and cope with larger forces of change.
The Chicago Community Networks (CCN) study attempts to understand the nature of such organizational networks using a data set that measures organizational relationships in nine neighborhoods of Chicago in 2013 and 2016. This five-part web series has used the data set to explore:
- Social network analysis as a tool to deepen understanding of community collaborations
- The ways power is configured in different Chicago neighborhoods
- How neighborhood organizations cooperate across domains of work to address complex issues
- The ways partnerships change over time
This feature is the last in the series and offers users the opportunity to interact with the CCN data set through a series of customized network maps that show interrelationships among organizations according to selected neighborhood characteristics and network statistics. Each graphic covers a different topic and shows how one can combine social networks and geographic areas to explore topics such as neighborhood resources, the relational patterns and capabilities of neighborhood actors, and the formation of partnerships within and outside each neighborhood.
This data set can be of interest to academics, funders, community organizations, and other stakeholders interested in learning how to strengthen and capitalize on organizational relationships to improve communities.
One
The Organizational Landscape
of Chicago Neighborhoods
Why It Matters
Neighborhood organizations are important actors in neighborhoods' ability to come together to bring about change. Organizations can provide services to neighborhood residents, bring together different segments of the community, and represent local interests. Moreover, local organizations can bring in resources and act as bridges between their neighborhoods and centers of decision making at the city, state, and federal levels.
The graphic in this section maps three aspects of the organizational life — the types of organizations in neighborhoods, their average budgets, and their primary domains of work — in nine Chicago neighborhoods at two points in time, 2013 and 2016. Users can use the information presented by the graphic to help identify a neighborhood's organizational assets and compare assets across neighborhoods, which may help them think of ways to strengthen existing organizational assets.
Example
In 2016, most neighborhoods had few organizations working on projects in the real estate domain. In seven of the nine neighborhoods, only 13 percent to 57 percent of surveyed organizations reported that they participated in projects related to affordable or mixed-income housing development, commercial real estate development, tenant organizing, homeowner education, or foreclosure prevention/mitigation. The data might suggest a general characteristic of this domain of work. Building affordable housing, for example, requires significant capital investment and a special set of organizational capabilities, two factors that together might make it difficult for organizations to enter this domain.
In contrast, in 2016, eight of the nine neighborhoods had 81 percent or more of surveyed organizations report that they worked in the education domain. Projects in this domain included early childhood programs, efforts to improve schools, tutoring and after-school initiatives, and other school enrichment activities. There might have been more activity in this domain because there were lower barriers to entry, as such education-related projects typically require less capital than projects related to real estate and housing.
Reading the Graphic
After you select a survey year and one aspect of organizational life using the dropdown menus, the map will change to display the proportion of surveyed organizations in each neighborhood sharing that characteristic.
Darker neighborhood colors represent higher percentages, while lighter colors represent lower percentages.
A fuller discussion of the survey process can be found at: How the Research was Conducted.
Further notes on each statistic can be found by clicking the icons.
Scope and Limitations of the Data: Neighborhood characteristics are based on organizations’ responses to the CCN survey. On the survey, each organization could select only a single organization type or budget size, but could select multiple domains of work. The CCN survey data do not represent a full census of all organizations or relationships in each neighborhood. However, they do cover enough to provide a good sense of each neighborhood’s organizations and relationships. It should be noted that about 13 percent of organizations closed their doors between 2013, when the first survey was fielded, and 2016, when the second survey was fielded. For a detailed description of the study, the sampling, and limitations of the data, please refer to the Chicago Neighborhood Networks report.
Two
Organizational Partnerships
in Chicago Neighborhoods
Why It Matters
Some neighborhoods are effective at launching new initiatives while others are hampered by fragmentation and mistrust. Some neighborhoods effectively mobilize diverse constituents to influence public policy while others have a hard time doing so. The ways organizations in neighborhoods relate to one another may explain some of the differences in their respective collaborative capacities. In this section, users can use the customizable graphic to generate maps of the relational patterns among organizations in nine Chicago neighborhoods. The structures that are illustrated may provide insights into each neighborhood's potential for effective collaboration.
Example
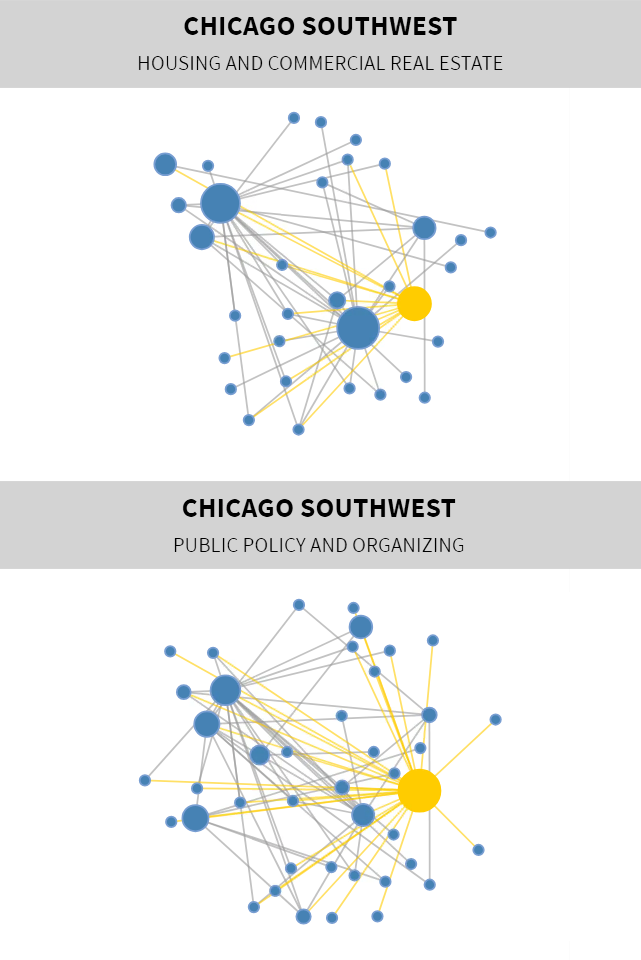
Chicago Southwest was hit hard by the foreclosure crisis of the late 2000s, which left behind many vacant and abandoned buildings. Organizations in the neighborhood sought to address this issue collectively.
In 2012, the Southwest Organizing Project (SWOP) joined with a diverse coalition of local partners to launch the Reclaiming Chicago Southwest campaign. The campaign's strategy involved purchasing and renovating abandoned properties so that they could be quickly reoccupied by long-time residents, in the hope that private developers would then be encouraged to invest in the remaining vacant properties.
The success of the campaign hinged in large part on SWOP's relationships with a diverse set of local partners, as well as its connections to local and regional public and elected officials. It might have been difficult to implement a similar initiative in a neighborhood where relationships had to be created anew or where no organization could serve to connect others.
As seen in the graphic, SWOP is connected to nearly every organization at work in the Real Estate domain, including a local Neighborhood Housing Services office (the second-largest circle). While some organizations partner directly with each other (their partnerships represented by gray lines), many are connected solely to SWOP (these partnerships represented in yellow). In other words, SWOP serves as an exclusive "broker," or gatekeeper, between some pairs of organizations that would not otherwise collaborate.
SWOP also partnered with many organizations in the Public Policy and Organizing domain. These partners (their partnerships with SWOP represented by yellow lines) include local groups (among them faith-based organizations and schools that allowed SWOP to connect with a broad set of constituencies), as well as public and elected offices and officials (among them Cook County officials, who were essential to expediting the sale of residential properties).
Reading the Graphic
Each graphic represents how neighborhood organizations partner with each other on projects in a domain of work.
Blue circles are local organizations. Yellow circles are neighborhood lead agencies, organizations charged with coordinating efforts among other local groups in the community.
Circle sizes vary depending on an organization’s relative level of power. The more influential an organization, the larger the circle. (To learn more, visit Power in Community Partnerships.)
Lines represent partnerships between organizations. Organizations rated the intensity of these partnerships on the following scale: Level 1 (attended meetings with or described work to partner), Level 2 (targeted efforts in coordination with partner), Level 3 (met or spoke regularly and shared resources with partner).
Further Applications
The side-by-side graphics in this section can be used to compare and contrast overall patterns of relationships across neighborhoods, or within the same neighborhood and across domains of work. The roles that individual organizations assume — whether as “brokers” (or exclusive connections to other organizations) or as members of a well-knit group of well-connected organizations (see a fuller discussion of well-connectedness in Power in Community Networks) — can also be examined.
Comparing graphs like these can help community stakeholders think of ways organizations in a neighborhood can expand or deepen their relationships in particular domains of work or understand whether certain organizations in a neighborhood might be well positioned to connect various actors in the neighborhood.
Scope and Limitations of the Data: The side-by-side graphics can also be used to compare a single network in 2013 with the same network in 2016. Users should be cautious in interpreting such changes over time as the data offer only a partial view of networks. In its analysis of network changes over time, the CCN study supplemented social network analyses with stakeholder interviews and contextual knowledge related to survey fielding efforts and organizational closures. For a discussion of these findings, please refer to Change in Community Networks.
Three
Neighborhood
and Aldermanic
Ward Boundaries
Why It Matters
In Chicago, the city council is made up of 50 elected aldermen who represent legislative districts called aldermanic wards. Organizations’ relationships to ward offices matter to community-level efforts because the city council makes decisions regarding zoning, land use, and housing development, among other subjects. Community improvement efforts often span more than one aldermanic ward and thus may require building relationships with more than one alderman's office.
In the map in this section, users can use the dropdown menus to view aldermanic ward boundaries overlaid onto neighborhood boundaries for each of the nine study neighborhoods. As the map shows, aldermanic ward boundaries and neighborhood boundaries do not coincide. Most neighborhoods are crossed by various ward boundaries. These overlapping boundaries can shape how community-level efforts are implemented.
Example
The fight to preserve affordable housing in Logan Square against a backdrop of rapid development and neighborhood change is a case in point.
Since 2013, Logan Square has experienced rapid change, accelerated in part by the passage of a Transit Oriented Development ordinance and the development of the 606, a former elevated rail line that was converted into a greenway connecting four northwest Chicago neighborhoods between 2013 and 2015. In particular, the areas surrounding the 606 trail have experienced sharp housing price increases and a boom in housing construction.
To counter these effects, the Logan Square Neighborhood Association, a local coordinating agency, started to promote affordable housing development in the neighborhood. It did so by forging partnerships with community development corporations that could identify properties suitable for conversion to affordable housing, local groups that could mobilize community support, and elected officials who could support necessary zoning changes.
As the map shows, six aldermen represented different parts of Logan Square in 2016. Community efforts to slow down the loss of affordable housing in the neighborhood therefore had to engage multiple ward offices. However, these aldermen have approached the issue from different angles and were not in agreement about the best solution to preserve affordable housing in the neighborhood.
Knowing which areas have more relationships between aldermen and organizations might suggest to those wanting to the prevent the loss of affordable housing that they should target particular aldermen, or point out to them those aldermen with whom it would make sense to build new relationships.
Reading the Graphic
The map represents neighborhood boundaries in black, and aldermanic ward boundaries in red. Moving the cursor over a ward will reveal the ward’s number.
Yellow circles are aldermanic ward offices, while blue circles are other organizations.
Yellow lines represent partnerships where at least one partner is an alderman, while gray lines represent relationships where neither partner is an alderman.
Circle sizes vary depending on an organization’s relative level of power (defined in terms of either “brokering ability” or “well-connectedness”).
The region surrounding Chicago’s central business district (“The Loop”) is circled in black on the map.
Further notes on each statistic can be found by clicking the icons.
Scope and Limitations:
The CCN study did not survey all of the aldermen whose wards intersect with the nine study neighborhoods. Therefore, the map cannot fully represent all of the collaborations between community organizations and aldermen in the city. But the map here does show the partnerships between those local organizations and those aldermen whom other entities identified as being actively at work in the study neighborhoods in 2013 and 2016.
Four
Connections Beyond
the Neighborhood
Why It Matters
Neighborhood-level efforts do not occur in isolation. Policies set at the city, county, and state levels are often involved, as are institutions and resources from outside the neighborhood. The graphic in this section reveals the partnerships that extend beyond an immediate neighborhood to connect local organizations with nonlocal organizations.
Example
As mentioned in Section Two, the national foreclosure crisis of the late 2000s resulted in abandoned properties and neighborhood blight in Chicago Southwest. In response, the Southwest Organizing Project (SWOP) launched a campaign to purchase and renovate abandoned properties so that they could be quickly reoccupied by long-time residents. SWOP’s relationship with Cook County was important to this campaign; the county was able to expedite the sale of properties to new owners because it could rely on local groups to find owners who could quickly reoccupy them. This partnership, and other partnerships between local organizations and organizations located outside the neighborhood, are shown in yellow.
Similarly, the efforts in Logan Square to maintain affordable housing units described in Section Three were supported by partnerships between the Logan Square Neighborhood Association (LSNA) and a citywide advocacy coalition. These relationships helped LSNA secure better access to vital resources and garner support for the affordable housing initiative among elected officials. Depicted in yellow, these many nonlocal connections included relationships with decision makers and other influential organizations.
Reading the Graphic
Neighborhood boundaries are represented in black.
Blue circles represent organizations that work in each neighborhood.
Yellow lines represent relationships where at least one partner is located outside the neighborhood, while gray lines represent those where both partners are local.
The region surrounding Chicago’s central business district (“The Loop”) is circled in black on the map.
Circle sizes vary depending on an organization’s relative level of power (defined in terms of either “brokering ability” or “well-connectedness”).
Further notes on each statistic can be found by clicking the icons.
Scope and Limitations The CCN survey asked neighborhood organizations to name all the other organizations they interacted with, including citywide organizations and government agencies. The maps in this section offer information about relationships between neighborhood organizations and actors outside the neighborhood, based solely on geographic location.
Five
Conclusion
Organizations' partnerships can be critical to their ability to carry out programs and improve low-income neighborhoods. Federal, state, and local policies focused on neighborhood improvement have long emphasized that community organizations need to share information and collaborate in the delivery of services. The partnerships that facilitate such coordination of activities are at the foundation of building "community capacity": a neighborhood's ability to come together to effect change.
The CCN study data set, collected as part of an extensive mixed-methods effort to measure the organizational landscape of nine Chicago neighborhoods, offers the opportunity to explore such local partnerships. Using the tools of social network analysis, the data set can be used to reveal patterns of community activity — including the distribution of power among local actors, ties between distant organizations and cores of activity, and the depth of community partnerships, among other topics.
Using the CCN data set to develop a better understanding of local collaboration and community capacity can be interest to practitioners, funders, academics, and other stakeholders interested in promoting conditions that support successful collective action, local problem solving, and community well-being over the longer term.
Authors:
Audrey Yu, M. Victoria Quiroz-Becerra, Edith Yang, Gloria Tomlinson
Published: April 2019
Design and Development: Stamen, Audrey Yu, Beth Sullivan, Litza Stark
Photos:
Always Shooting,
Ferdinand Stohr (CC BY 3.0)