The Power Under Multiplicity Project


Researchers are often interested in testing the effectiveness of an intervention on multiple outcomes. As discussed in an earlier Reflections on Methodology post, researchers often use multiple testing procedures to reduce the likelihood of false positive findings. However, this strategy can also substantially reduce the probability of detecting effects when they truly exist.
This post introduces two open-source software tools from the Power Under Multiplicity Project (PUMP). These tools help researchers plan frequentist analyses of multilevel randomized controlled trials (RCTs) when incorporating the use of multiple testing procedures. PUMP users can estimate power, minimum detectable effect size, and sample size requirements. PUMP also allows researchers to consider multiple definitions of power so they can choose the most appropriate types of power for the goals of their studies. For example, when testing for effects on multiple outcomes, one might consider:
- 1-minimal power, the probability of detecting effects of at least a particular size on at least one outcome
- ½-minimal power, the probability of detecting effects of at least a particular size on at least half of the outcomes
- Complete power, the power to detect effects of at least a particular size on all outcomes
This post describes the PUMP R package and the PUMP app, which were developed with funding from a Statistical and Research Methodology in Education grant from the Institute of Education Sciences (IES) (R305D170030). The core methods used in these products were originally developed in an earlier IES grant (R305D140024).
PUMP R package: The PUMP R package fills an important gap in open-source software tools for designing multilevel RCTs with adequate statistical power. To the authors’ knowledge, none of the existing software tools for power calculations (for example, PowerUp! from Dong and Maynard, 2013; Optimal Design from Raudenbush et al., 2011; and Spybrook et al., 2011) allow researchers to account for multiple hypothesis tests and the use of a multiple testing procedure. The PUMP R package has three core functions:
- pump_power() for calculating power given an experimental design and assumed model, parameters, and effect size
- pump_mdes() for calculating minimum detectable effect size given a target power and sample sizes
- pump_sample() for calculating required sample size for achieving a given target power for a given minimum detectable effect size and sample sizes at other levels
For any of these core functions, the user begins with two main choices. First, the user chooses the design and model of the RCT. PUMP covers a range of multilevel designs—designs in which research units (such as students) are nested in larger groups (such as classrooms or schools)—that researchers typically use in practice. The package allows up to three levels of hierarchy. For example, a design may feature students nested within schools nested within districts. The power calculations assume the user will be analyzing these RCTs using an appropriately chosen frequentist, mixed-effects regression model containing a combination of fixed or random intercepts and treatment impacts at different levels.
Second, the user chooses the multiple testing procedure to be applied. PUMP supports five common procedures: Bonferroni (Dunn 1959, 1961), Holm (1979), single-step and step-down versions of Westfall-Young (1993), and Benjamini-Hochberg (1995).
Figure 1 is an example output plot from a PUMP call. The plot shows power across several definitions and multiple testing procedures for a single context (design, model, and parameter choices).
Figure 1. Adjusted Power Across Different Definitions of Power
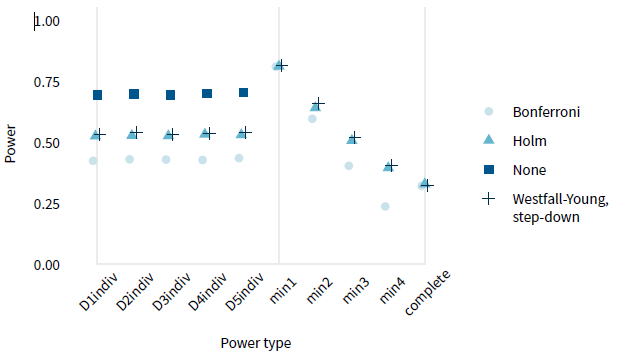
NOTES: This graph shows estimated power for a hypothetical experiment with five outcomes. The first five points (D1indiv through D5indiv) show individual power for each of the outcomes: The first point is individual power for the first outcome (D1indiv), the second point is individual power for the second outcome (D2indiv), etc. The order of the outcomes is specified by the user; for example, perhaps the first three outcomes are reading scores and the final two outcomes are math scores. In this example, all outcomes are assumed to have the same effect size. The next four points (min1 through min4) show the power to detect an effect on at least one outcome out of the five (min1), two outcomes out of the five (min2), etc. The last point (complete) shows the power to detect effects on all outcomes.
After selecting the design, model, and multiple testing procedure, the user must also choose parameters of the data-generating distribution (such as the assumed R2 values of any planned covariates, the intraclass correlation coefficients at different levels, and treatment-impact heterogeneity at different levels).
The package also includes functions that allow users to easily explore and visualize power, minimum detectable effect sizes, and sample size over given ranges of values. These functions are intended to encourage the user to determine the sensitivity of power, minimum detectable effect sizes, or sample sizes to different assumptions. These additional functions, which are useful both for settings with multiple outcomes and settings with a single outcome, are:
- pump_power_grid(), pump_mdes_grid(), and pump_sample_grid() for calculating the given output over a range of possible parameter values
- update() to rerun an existing calculation with a small number of parameters updated
- plot() to generate plots (including plotting grid outputs)
For example, generating the power curves shown in Figure 2 as a function of the number of level 3 units (for example, the number of school districts in the example given earlier) requires only two commands (one to calculate power, one to plot).
Figure 2. Minimum Detectable Effect Sizes for Different Numbers of Level-Three Units, for Two Multiple-Testing Procedures
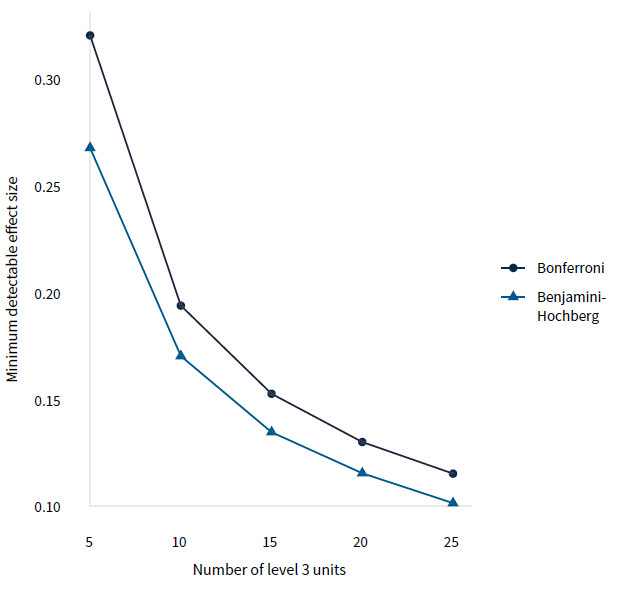
NOTE: This graph shows information on minimum detectable effect sizes for designs in which individuals (the level 1 unit) are nested in something (the level 2 unit) that is nested in something else (the level 3 unit). For example, students (level 1) might be nested in schools (level 2) that are nested in school districts (level 3). The horizontal axis shows the number of level 3 units and the figure shows how minimum detectable effect sizes vary with the number of level 3 units.
The PUMP package is available at the Comprehensive R Archive Network (CRAN) and on GitHub. The methods developed for the package, details on the functions in the package, and comprehensive examples illustrating use can all be found in Hunter, Miratrix, and Porter (under review) and Porter (2018). In addition, code and results from a comprehensive validation of these methods can be found here.
PUMP app: The PUMP app is a web application built with R Shiny, an R package for interactive web apps. The PUMP app calls the PUMP package and allows users to conduct most of the same calculations as the package using a user-friendly interface. The app focuses on a subset of simple scenarios rather than reproducing the full package’s functionality (for example, it is limited to 10 outcomes or fewer), but covers the most common needs of applied researchers.
In the app, users will find the following tabs that provide background information, instructions for using the app, and two approaches for carrying out calculations:
- Why Use the PUMP App provides background information on the challenges of investigating impacts on multiple outcomes in RCTs, including why adjustments to p-values are needed and the impact those adjustments can have on power, minimum detectable effect sizes, and sample size requirements.
- PUMP Designs and Models describes the designs and models supported by the PUMP app, along with naming conventions. There is also a link to download detailed documentation.
- PUMP Multiple Testing Procedures describes the multiple testing procedures incorporated in the PUMP app and considerations for selecting among them.
- How to Use the PUMP App gives guidance for using the app, including an instructional video.
- Power, Minimum Detectable Effect Size, and Sample Size Explorer allows users to select a specific RCT design and model; choose whether to estimate power, minimum detectable effect size, or sample size requirements; and enter required assumptions. The tab returns estimates in a table and a plot, both of which can be downloaded.
- Single Scenario Power Estimator allows users to select a specific RCT design and model and enter required assumptions. The tab returns estimates in a table and a plot, both of which can be downloaded.