Do Meta-Analyses Oversell the Longer-Term Effects of Programs? (Part 2)
Attempting to Correct for Follow-Up Selection Bias


The U.S. Department of Education’s What Works Clearinghouse (WWC) recently published a practice guide for educators on Effective Advising for Postsecondary Students. One recommended practice is to “transform advising to focus on the development of sustained, personalized relationships with individual students throughout their college career.” A companion post discussed why there is good reason to think this recommendation is based, at least in part, on an overestimate of the effects of the practice on graduation rates. The argument is based on the idea that studies that collect information on longer-term outcomes, such as graduation rates, tend to be special—selected, in part, because of their larger-than-average effects on shorter-term outcomes. This post describes a way to use information on short-term outcomes—in this case, reenrollment or progress toward a degree—to estimate how much the effects on long-term outcomes are overstated in such meta-analyses.
Why We Think There Is Bias
The starting point for the discussion is Figure 1, which is repeated from the companion post. The figure shows the distribution of effects from a database called THE-RCT.[1] The figure shows estimated effects on enrollment in the second semester for studies that measured graduation for all sample members (labeled “Yes”) and those that did not (labeled “No”). As can be seen, more of the estimated effects on enrollment in the second semester are null or negative for studies labeled “No,” and the average effect is also smaller.
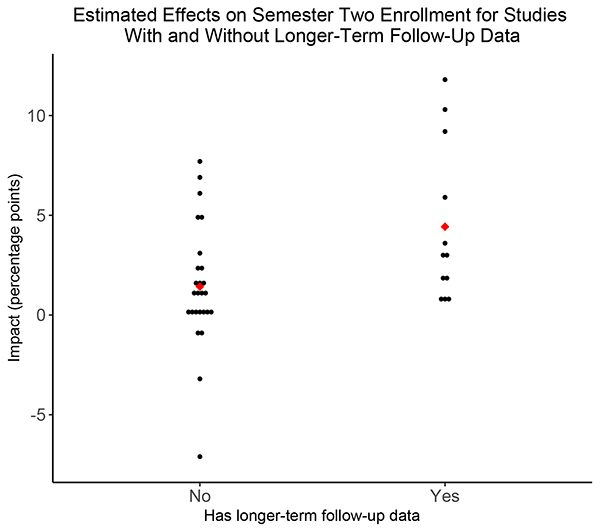
Figure 1: Short-term effect estimates in the THE-RCT sample
Correcting the Bias
Figure 1 provides evidence that effects on graduation rates might be overstated, but it does not indicate how much they are overstated. One way to assess how much they are overstated is to estimate the relationship between shorter-term and longer-term effects and to use that relationship to impute longer-term effects for the studies that did not collect that information. For THE-RCT, this relationship is shown in Figure 2, which compares estimated effects on second-semester enrollment (the horizontal axis) with estimated effects on three-year graduation rates (the vertical axis). As shown, interventions with larger effects on second-semester enrollment tend to have larger effects on three-year graduation rates. The best linear relationship between the two sets of effects is shown by the upward line, which has a slope of 1.3. This relationship means that if one intervention has an estimated effect on second-semester enrollment that is 1 percentage point larger than that of another intervention, the first intervention would be predicted to have an estimated effect on three-year graduation rates that is 1.3 percentage points larger than the second intervention.
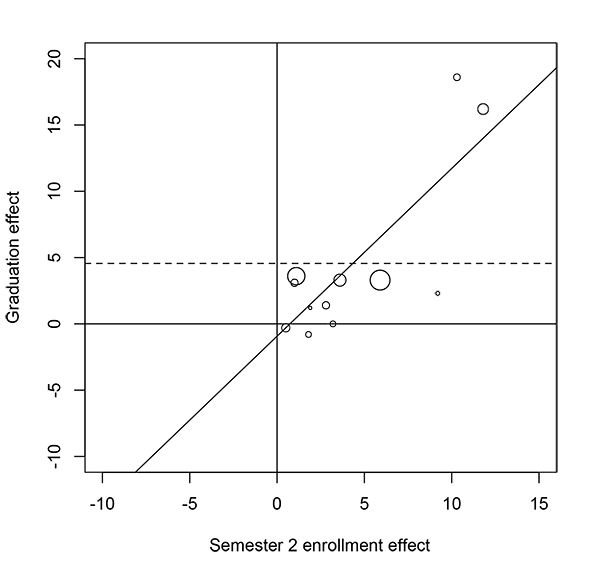
Figure 2: Short-term estimated effects and longer-term follow-up effects from 12 studies in the THE-RCT sample that have both short-term and longer-term effects.
Note: The dotted line represents the precision-weighted mean effect on graduation.
Figure 3 repeats the information from Figure 2, but adds predictions for studies that did not collect information on three-year graduation rates. Those studies are shown by the red circles that lie along the prediction line. Using all studies shown in Figure 3 suggests an overall average effect on three-year graduation rates of 1.7 percentage points, which is much smaller than the average of 4.6 percentage points drawn from the studies that collected information on three-year graduation rates.
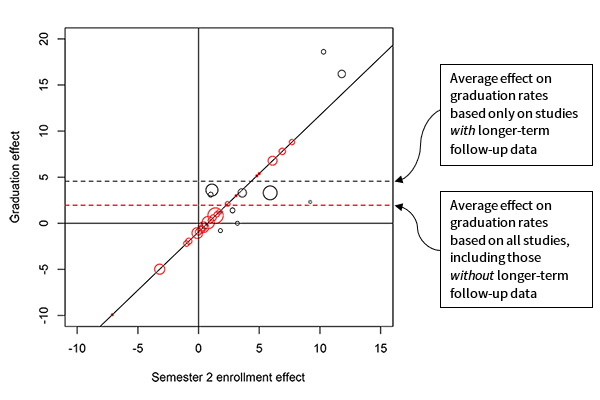
Figure 3: Short-term estimated effects and longer-term follow-up effects from all studies in the THE-RCT sample, with imputed longer-term follow-up effect estimates from studies that did not have longer-term follow-up data.
The What Works Clearinghouse Case Example
The companion post showed that estimated effects on a short-term outcome—progressing in college—were larger in studies that measured effects on graduation rates (0.44 standard deviations on average) than they were in those that did not (0.14 standard deviations).[2] This difference suggests that the estimated effects on graduation described in the WWC meta-analysis are overstated.
The left panel of Figure 4 repeats the analysis shown in Figure 3 using the WWC data. In this case, the estimated average effect on graduation falls somewhat—from 0.27 standard deviations to 0.22 standard deviations—when the imputed effects are included.[3]
However, the relationship between interventions’ shorter-term effects on “progress” and their longer-term effects on “graduation” has some questionable implications. For one thing, it implies that an intervention that reduces progress by 0.20 standard deviations would not reduce graduation rates. Such a relationship seems theoretically implausible, although it could suggest that interventions influence graduation rates through mechanisms other than progress. The nonzero intercept also could reflect sampling error. If we constrain the x-intercept to 0 and reimpute effects on graduation rates, the adjusted mean falls to 0.18, a reduction of 1/3 from the original estimate, as shown in the right panel of Figure 4.
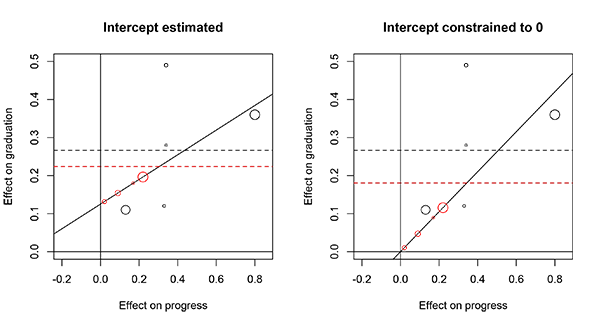
Figure 4: Short-term estimated effects and longer-term follow-up effects from all studies in the WWC sample, with imputed follow-up effect estimates from studies that did not have longer-term follow-up data, under two different models.
This example illustrates that the relationship between short-term and longer-term effects may be sensitive to assumptions about the association between the two effects. The importance of those assumptions could be better understood with more information on the longer-term effects of studies with short-term effects near zero, particularly in cases where an intervention might affect longer-term outcomes without improving the short-term outcome.[4]
Implications
We hope this post leaves the reader with the following points to consider in future work:
- Look at short-term outcomes. A meta-analysis that examines effects on longer-term outcomes should make sure studies with longer-term outcomes do not differ from others systematically. The example in this post used one short-term outcome to infer whether longer-term effects might be overstated, but other information such as estimated effects on other outcomes or the characteristics of people or locations included in the study might also help (and are often included in meta-analyses).
- Collect information that will be predictive of longer-term effects. The approach described in this post can be used if different studies all collect comparable short-term effect measures or other information that will help predict longer-term effects. In some fields, particularly those with well-specified longer-term aims and mediating processes, these conditions may already be met. In other cases, researchers might need to collaborate to collect comparable information before the bias in longer-term estimates can be assessed.
Finally, we note that the simple regression approach we outlined here was intended to be illustrative and we have not thoroughly studied its statistical properties nor described the assumptions under which it would yield unbiased results. Others (for example, Athey, Chetty, Imbens, and Kang) offer more complex approaches, extensions of which could apply to this type of meta-analysis.[5]
[1]John Diamond, Michael J. Weiss, Colin Hill, Austin Slaughter, and Stanley Dai, “MDRC’s The Higher Education Randomized Controlled Trials Restricted Access File (THE-RCT RAF), United States, 2003-2019,” Inter-university Consortium for Political and Social Research [distributor], https://doi.org/10.3886/ICPSR37932.v2.
[2]For WWC’s definition of “progressing in college,” see page 8 of WWC Review Protocol for the Practice Guide on Effective Advising for Postsecondary Students.
[3]The authors’ calculation of the average effect of 0.27 differs from the published average effect of 0.29.
[4]Tyler W. Watts, Drew H. Bailey, and Chen Li, “Aiming Further: Addressing the Need for High-Quality Longitudinal Research in Education,” Journal of Research on Educational Effectiveness 12, 4 (2019): 648–658.
[5]Susan Athey, Raj Chetty, Guido W. Imbens, and Hyunseung Kang, "The Surrogate Index: Combining Short-Term Proxies to Estimate Long-Term Treatment Effects More Rapidly and Precisely," NBER Working Paper No. 26463. (Cambridge, MA: National Bureau of Economic Research, 2019).