Change in Community Networks


Change
in Community
Networks
How partnerships
evolve and
how they are
sustained
Partnerships to improve schools, protect homeowners from foreclosure, and mobilize to inform public policy all change over time. The number and nature of local collaborations can grow, diminish, or shift. So can the leadership and influence of individual organizations within collaborations.
In some cases, partnerships may change deliberately, in response to new circumstances such as new federal, state, or local political agendas; demographic shifts in neighborhoods; or changes in funding opportunities. In other instances, the strain of external stresses, such as state budget cuts, neighborhood violence, or potential school closures, may make it harder to maintain partnerships at all. This feature explores both sustaining and adapting partnerships in the face of external events.
This feature is part of a series sharing results from the Chicago Community Networks Study. Previous features explored Power in Community Networks and Comprehensiveness in Community Partnerships.
One
What Is Network
Change?
Because the Chicago Community Networks Study involved two waves of a survey, one conducted in 2013 and the second in 2016, it is possible to explore the ways that local networks evolved and how they were sustained over time in nine Chicago neighborhoods. This feature illustrates the network changes observed between 2013 and 2016, a time when Chicago faced ongoing struggles with violence, state budget woes that delayed payments to service providers, and heightened public concerns about police violence.
This section uses hypothetical examples to illustrate concepts of network change. Later in this feature, these concepts will be connected to data in an actual neighborhood.

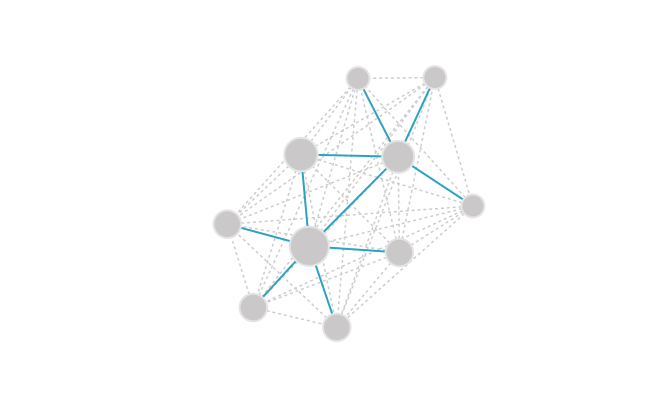
In this hypothetical neighborhood, each circle represents a community organization. The size of each circle reflects that organization’s relative level of influence in the network. Each line represents a partnership—for example, a school and a youth group collaborating on after-school enrichment.

Here the sample neighborhood network is shown as it appeared in 2013, and again as it appeared in 2016.
Over the course of those three years, the relationships in this sample neighborhood undergo several types of change.
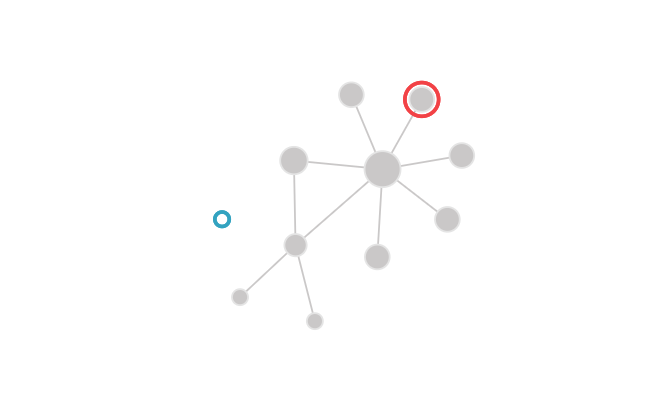
In 2013, the network has 10 organizations actively at work on projects related to education. However, between 2013 and 2016, one organization present in 2013 disappears from the network, while another organization that is absent in 2013 joins the network.
The circle that disappears represents an organization that closed its doors, that ceased being active on projects in the education domain, or that moved to a different neighborhood. The partnerships between that organization and other organizations in the neighborhood also disappear.
The circle that appears represents an organization that either opened its doors or began to work in the education domain after 2013. In 2016, the new organization is still something of a peripheral agent in the neighborhood, with just one tie to another organization.
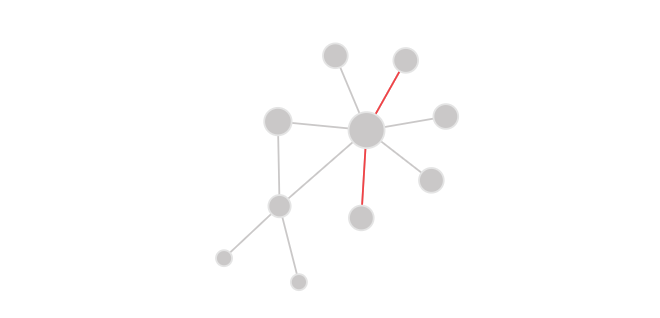
Over time, partnerships between organizations in a network may also change.
Some partnerships that exist in the 2013 network depicted here (such as those highlighted in red) disappear by 2016. These connections might represent collaborations between pairs of organizations that ended during those three years.
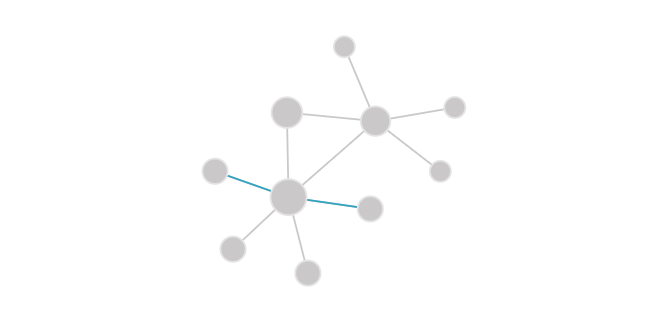
By 2016, the partnerships highlighted in red have disappeared. However, some new partnerships (highlighted in blue) that did not exist in 2013 have formed. These connections might represent new collaborations between pairs of organizations.
Because the number of partnerships that disappear is the same as the number of new partnerships that form, the overall “level of partnerships” (or density) in the network as a whole is the same in 2013 and 2016. In both years, of the 45 partnerships that could have formed between pairs of the 10 organizations in the network, a total of 10 partnerships actually exist in each year. This proportion can be reported as a percentage: 22 percent.
To illustrate, the network in 2016 is shown here with potential partnerships represented by dotted lines, and actual partnerships represented by solid blue lines.
Changes in the number of organizations and partnerships in the network have implications for the structure and hierarchy of the network as a whole.
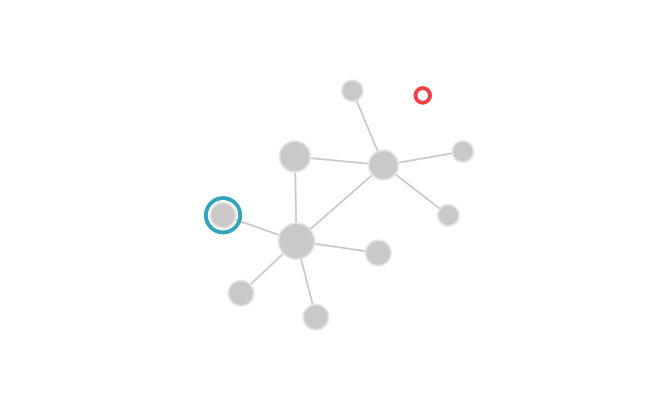
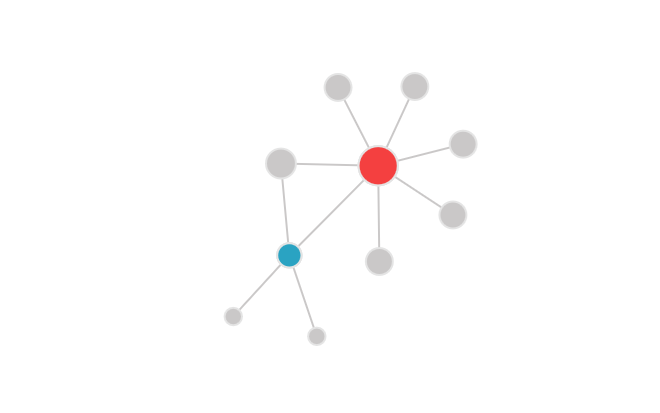
In particular, the concentration of influence in the network can change. In this slide and the next, the blue organization shows an increase in “well-connectedness” (a type of network influence discussed in a previous feature) from 2013 to 2016, while the red organization shows a decrease in “well-connectedness” from 2013 to 2016.
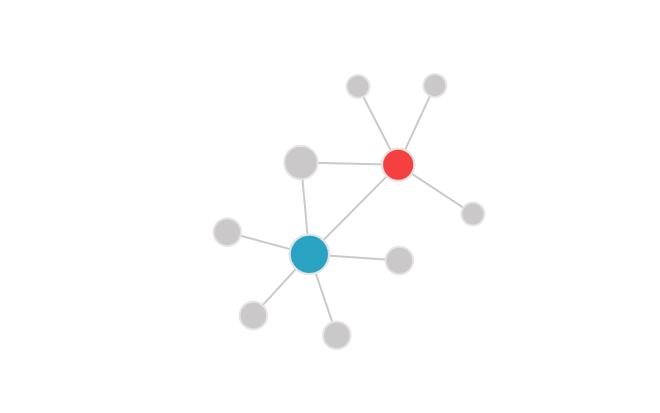
The blue organization increases in well-connectedness from 2013 to 2016 in part because it forms many new partnerships with other organizations that are themselves well-connected. In contrast, the red organization decreases in well-connectedness in part because it loses some partnerships. As a result, the red organization has fewer paths of connection through which it can spread its influence to other organizations.
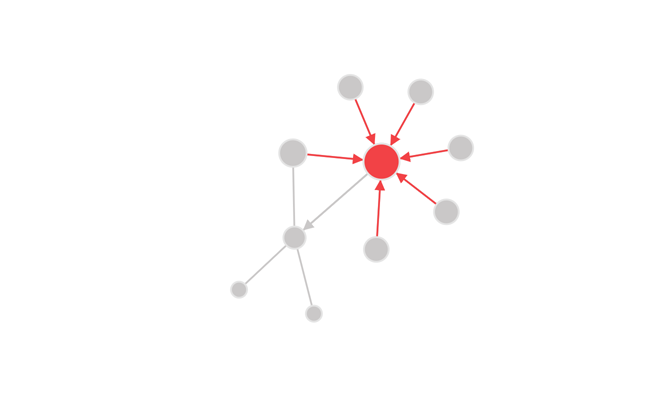
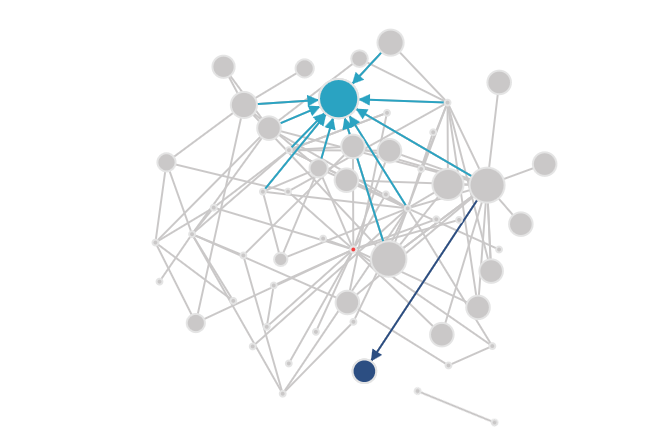
Here is a closer look at some specific changes in partnerships that could have affected the hypothetical red organization's influence within the network.
In 2013, six organizations indicate that the red organization is a partner. These in-directed ties (that is, directed toward the red organization from a partner organization) are shown in red.
Out-directed ties (that is, ties from the red organization directed toward those it named as partners) are shown in gray.
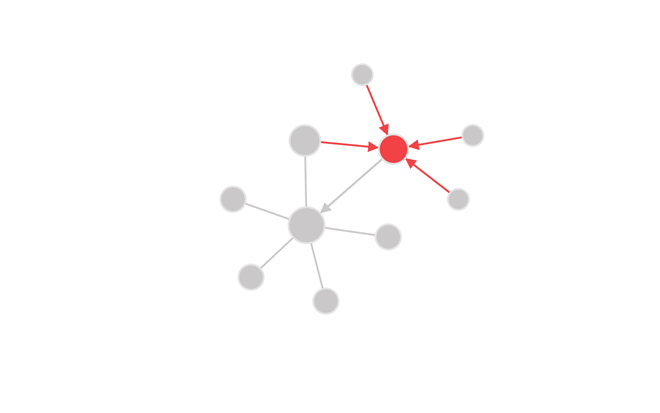
In 2016, fewer organizations “name” the red organization as a partner.
Two
Why Network Change
Matters for
Public Policy
In many cases, to respond to new challenges or opportunities, local organizations may need to shift or adapt how they partner with each other. In the public management literature, this concept is known as network adaptation. And in fact, during the period of the CCN study between 2013 and 2016, Chicago’s neighborhoods contended with several major problems, as outlined above.
Under such difficult circumstances, organizations may need to make new kinds of connections to continue service partnerships and may need different kinds of coalitions to change public policy. On the other hand, budget cuts may also make it hard for groups just to sustain important partnerships, making it important to find ways of maintaining networks over time.
The following example shows how a community organization navigated these circumstances in one neighborhood on the west side of Chicago, and offers a comparison to the other study neighborhoods.
Three
Changing
Leadership Dynamics
in Austin
One finding across the nine study neighborhoods was that agencies charged with coordinating local work appeared to be more well-connected in 2016 than they were in 2013. The case of Austin, and the increased well-connectedness of Austin Coming Together (ACT), illustrates this theme.
ACT is an organization formed in 2011 to convene community stakeholders and to coordinate service delivery in the neighborhood. MDRC’s network analysis and qualitative research both suggest that ACT increased in well-connectedness between 2013 and 2016.
How did this change happen?
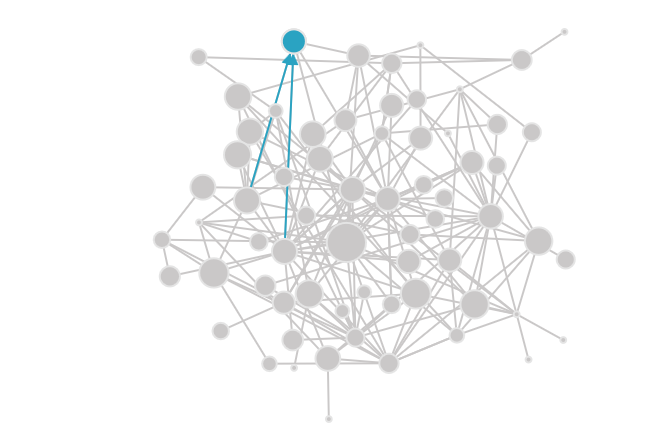
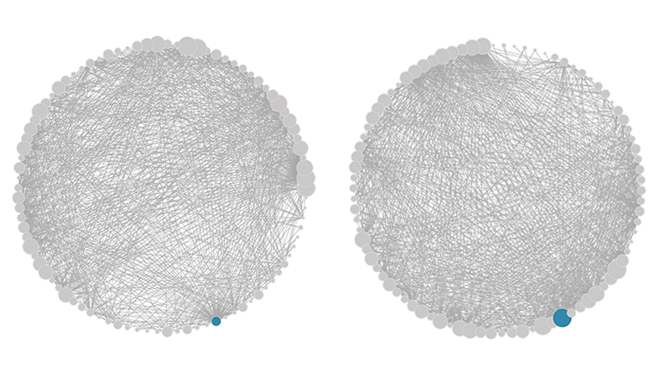
In 2013, ACT was a recently created organization that was developing its partnerships in Austin. As a result, it was not very central to the network of education partnerships.
Its relative level of influence is reflected in the illustration: ACT is a relatively small circle, and only a few other organizations named it as a partner.

Funding
Between 2013 and 2016, ACT gained resources and opportunities that positioned it to build connections with other neighborhood organizations. ACT became part of United Way’s Neighborhood Network Initiative, it received subcontracts from neighborhood partners to lead local coordination efforts, and LISC Chicago supported ACT’s neighborhood efforts. In 2016, LISC Chicago invited ACT to convene a quality-of-life planning process in Austin.
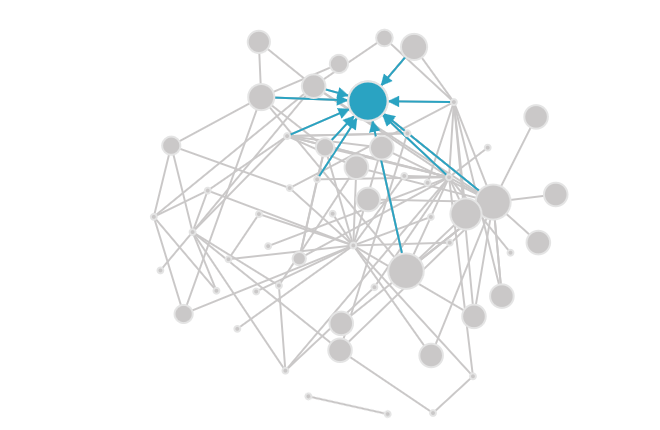
By 2016, ACT had become more well-connected in the network, as reflected by the increased number of organizations that reported they partnered with ACT in education. In 2013, ACT was ranked thirtieth in well-connectedness, while in 2016, it was ranked first.
Generational Shifts in Leadership
Some of ACT's new gains in well-connectedness took place alongside other changes in inter-organizational dynamics in Austin.
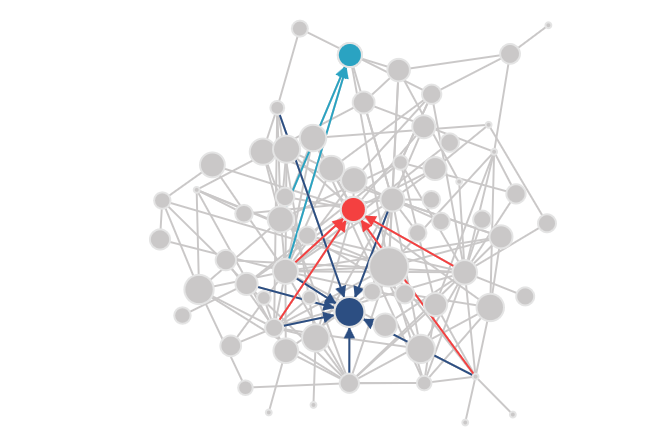
In 2013, two other well-connected organizations (represented in red and dark blue) often led community development activities in the neighborhood. In 2013, both organizations were larger than ACT, and more organizations recognized the two as partners.
Between 2013 and 2016, the two well-connected organizations experienced transitions in their leadership teams. During these transitions, the organizations' partners collaborated with the two less frequently.
By the time the 2016 survey was fielded, fewer local organizations identified the red and the dark blue organizations as their partners than was the case in 2013.
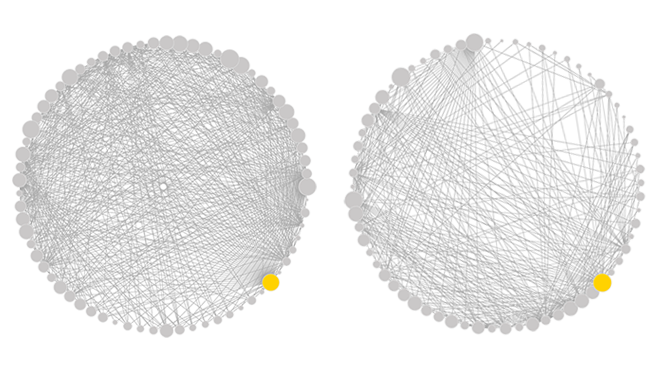
Whole-Network Change Between 2013 and 2016
As a “coordinating agency” charged with encouraging increased collaboration among local organizations, ACT may have not only increased its own well-connectedness in the network, but its work also may have affected the neighborhood's network as a whole.
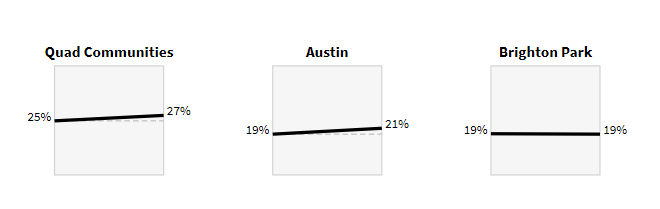
As shown here, Austin is one of three study neighborhoods whose overall level of partnerships in 2013 and 2016 were roughly the same.
As discussed above, the level of partnerships is expressed as the proportion of partnerships that did form relative to those that potentially could have formed.
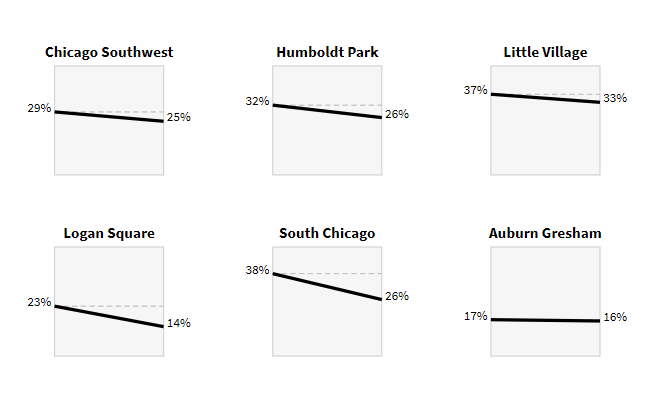
This similarity is notable because it took place in the context of a state budget crisis that reduced the financial stability of local organizations. Most of the nine study neighborhoods saw decreases in density between 2013 and 2016, with the neighborhoods of Logan Square and South Chicago experiencing the steepest declines.
Field research efforts in Logan Square reveal some of the reasons behind that neighborhood’s decline in level of partnerships.
A Contrast to Austin
Between 2013 and 2016, Logan Square experienced an acceleration of gentrification pressures, while many of its schools and local organizations were also hurt by the state budget crisis. For example, the Logan Square Neighborhood Association (LSNA), an organizing group that had coordinated neighborhood efforts and had a long history of working with schools, experienced both a loss of funding and an increasing demand for organizing efforts related to affordable housing preservation. The various “shocks” the community experienced might in part explain the decline in the neighborhood’s overall level of partnerships.
Comparing the cases of Austin and Logan Square may suggest that, in an era of heightened financial stress for nonprofits and public institutions, explicit investments that support an organization’s partnership-building efforts and coordination activities among local organizations can contribute to maintaining partnerships in its neighborhood.
Four
Conclusion and
Looking Forward
This feature has explored the changing nature and character of community partnerships. In particular, it has highlighted:
- How community organizations may shift or adapt the way they partner with each other and affect the system of community collaboration as a whole, and how social network analysis can illustrate these changes.
- How a challenging funding environment for nonprofits and public institutions, along with other neighborhood shocks (such as the gentrification pressures observed in Logan Square) may have an effect on these processes.
- As shown in the case of Austin, how explicit and dedicated investments that support a convening organization's local partnership-building efforts and coordination activities can contribute to maintaining and fostering partnerships in its neighborhood despite a challenging funding environment.
A print report published in late 2018 will explore these themes in more detail.
Authors:
David M. Greenberg, Stephen Nuñez, M. Victoria Quiroz-Becerra, Aurelia De La Rosa Aceves, Sarah Schell, Edith Yang, Audrey Yu
August, 2018
Design and Development: Stamen, Audrey Yu, Beth Sullivan, Litza Stark
Photos:
Phil Dokas (CC BY-NC-SA 2.0) ,
NASA (CC BY 3.0)