Data-Driven Program Management in Student Support Programs


Community colleges serve as important pathways to the middle class for millions of Americans. But graduation rates at these institutions are low, particularly among students from families with low incomes, first-generation college students, and students of color, who may face multiple barriers to completing a degree. The COVID-19 pandemic underscored those challenges as well as the importance of providing multifaceted support services that not only help students plan their academic journeys but also reduce the financial, physical, or emotional stresses that can derail college completion goals.
MDRC’s Scaling Up College Completion Efforts for Student Success (SUCCESS) project, now operating in 13 colleges across five states nationwide, seeks to improve graduation rates for traditionally underserved students at two- and four-year colleges. The MDRC research team partners with states and institutions to develop and implement large-scale, financially sustainable, evidence-based support programs that center on proactive coaching, financial incentives, full-time enrollment, and data-driven program management, the focus of this blog post.
When MDRC works with a college to launch a SUCCESS program, the team often summarizes its approach to using data with a simple but powerful statement: Use data as a tool rather than a report card. What does that mean? Too often, data are treated as an end result rather than as information that can be used to support ongoing program management and daily tasks. MDRC works with frontline staff members to help them find ways to keep tabs on key performance measures in real time and then act when those measures aren’t moving in the right direction. In practice, this data-driven approach involves three steps:
- setting challenging but realistic benchmarks for key student outcomes,
- establishing continuous monitoring processes that engage multiple stakeholders, and
- crafting a data routine that promotes transparency, accountability, and learning.
Set the Standards
As a comprehensive student support program, SUCCESS has the potential to have an impact on student outcomes beyond the primary goal of on-time degree completion. For instance, an important part of the SUCCESS model is that students stay enrolled in school full time, a requirement rooted in extensive evidence that shows that continuous, full-time enrollment as part of a multifaceted, long-lasting program can improve academic momentum. So the staff of a SUCCESS program might be interested in comparing their students' enrollment data with that of a broader representative population, in order to understand if their services are, in fact, encouraging students to enroll full time at a higher rate than their peers. These types of comparisons provide agreed-upon benchmarks of program success that can be valuable tools for monitoring and increasing impact.
In the example below, a simple, color-coded spreadsheet serves as a powerful tool to examine trends in key outcomes. The goals are ambitious, but realistic. For instance, the spring enrollment goals are slightly lower to account for some expected attrition. A program coordinator might look at this table and wonder: Why did fewer students meet with their advisor twice in the spring, and how can we reverse that trend? What might explain the slight increase in average credits earned?
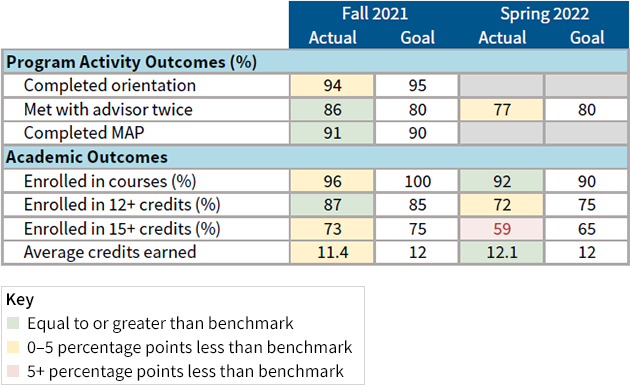
One SUCCESS coordinator uses a semesterly report on full-time enrollment much like the one above to craft personalized academic plans for students who have reduced their credit loads or stopped taking classes altogether. “One student went from sitting out one semester, to taking two courses the next semester, to being enrolled full-time for the upcoming spring 2022 semester,” the coordinator said. “They needed to ease into a structure that they could reasonably handle so they would not become overwhelmed and end up failing their courses.”
This story highlights an important and sometimes overlooked aspect of benchmarking: The goals you set should be ambitious, but realistic. In the context of the COVID-19 pandemic, for example, going from being unenrolled to taking 12 credits would simply not have been realistic for some students. This coordinator acknowledged the tradeoff, noting, “[The impact of] COVID-19 continues to play a role in students’ [decisions] when balancing work, family, and school…. So being part-time and moving forward slowly is still progress, even when it is not at the pace we would like [to see].”
Find the Right Balance
Setting benchmarks is only useful when program staff members have access to solid, real-time student data they can use to measure performance. Easy and timely access to this data empowers staff members to take ownership of the success of their students and the program as whole, and therefore motivates continuous improvement. However, while conversations on this topic tend to focus on how to use more data, it is possible to use too much data: As technology advances, institutions are collecting more student information than ever, and trying to make sense of it all at once can quickly become overwhelming.
That’s why MDRC works with its SUCCESS partners to determine the right balance of detailed and aggregate data measures to monitor. Detailed data are granular and often student-level, such as individual grades and course loads, which SUCCESS staff members can use to triage their caseloads and react immediately to important changes on a day-to-day basis. Another SUCCESS coordinator and her team look at this type of student data on a daily basis to identify “who is participating, who is enrolled, who is below [12] credits.” They then use that information to “set the plan for that day, who needs to be contacted, who needs to be re-enrolled.”
Detailed data are granular and can be used to react immediately to important changes on a day-to-day basis. Aggregate data, on the other hand, reveal broad changes in program activity over a period of time and are useful for measuring progress against benchmarks and understanding important trends.
Aggregate data, on the other hand, such as the percentage of students meeting program requirements, reveal broad changes in program activity over a period of time and are useful for measuring progress against benchmarks and understanding important trends. SUCCESS coordinators, for example, such as the one just mentioned, often use aggregate data to help ensure that their teams are serving students’ needs. The management information system that this coordinator and her team use to track program activity includes a dashboard that shows how many students have met their coaching requirements for the month. When the numbers are lower than she would like, the coordinator brainstorms with her team to discover possible explanations and solutions. One December, when the numbers were lower than in previous months, her team told her that students were swamped with finals and the craziness of the holiday season. So the coordinator decided to reduce the coaching requirements for that month, to lessen the burden on students.
Establish a Data Routine
While monitoring data isn’t new to most SUCCESS staff members, integrating that data into daily program improvement tasks often is. Doing so takes time, practice, and patience. One concrete way that SUCCESS teams establish data routines is by letting the data drive their regular team meetings. Here’s an example of how you can structure conversations with your staff that puts data in the driver’s seat:
1. How does the current data compare with expectations?
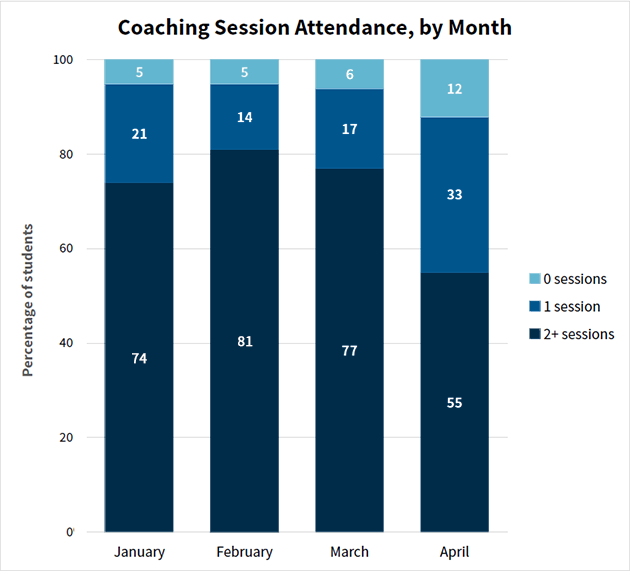
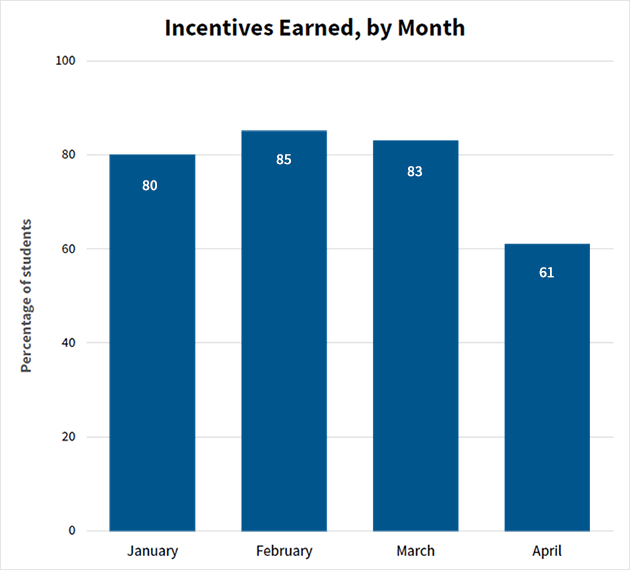
We’re looking at our monthly engagement report for April and our students seem less engaged than usual. Fewer students met with their coaches than last month, and fewer met their program expectations and, in so doing, earned their incentives.
2. Are there any metrics that we should analyze more closely to understand what happened?
Let’s look at the percentage of students who earned incentives, because that indicates how many students are meeting program expectations.
Specifically, let’s look at some subgroups of students by age, race, parental status, and so on, to see if there are any substantial differences among them.
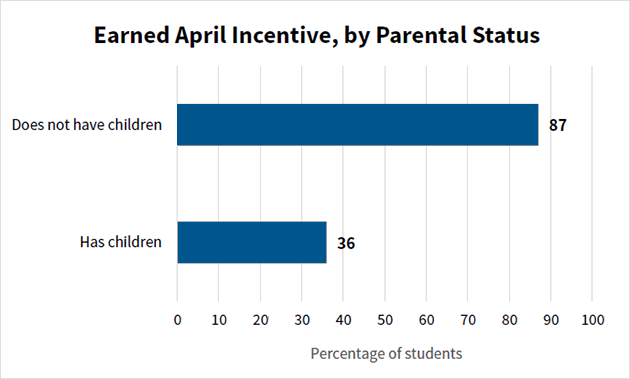
It turns out the group that did not earn their incentives in April are disproportionately parents. After some group discussion, we realized that a lot of those parents had to deal with their kids being out of school in the middle of the month on spring break – which made scheduling coaching sessions difficult.
3. What are our next steps to improve the outcomes?
Let’s have coaches make a point of reaching out to these students to ask what accommodations they need. Perhaps parents would benefit from alternative and less burdensome ways to meet their coaching requirements (such as virtual sessions or shorter meetings).
4. What are our expectations for the next report?
Next month, we will again break down incentive earning by parental status. We expect that there will be a smaller gap than this month.
Takeaway Tips
SUCCESS programs operate in a variety of contexts and populations, but the lessons learned about establishing a data-driven program management approach are the same:
- Interact with and use the data every single day. Real-time monitoring allows staff members to respond quickly and adapt to changing student needs.
- Use data as a tool, not a report card. Or, put another way, “Use data as a flashlight, not a hammer.” Spotlight areas for improvement throughout the year, rather than waiting until the end of the year and then using data to decide whether or not the program “worked.”
- Invest the necessary time: In the short term, data-driven management can help programs serve students more effectively and efficiently, especially in environments where resources are constrained. In the long term, it can help determine the impact of the program and inform future efforts for student success.
MDRC works with many other organizations that are using data for program management in innovative ways. Learn about how the Building Bridges and Bonds project used program data to improve an intervention designed to support economic stability for justice-involved individuals seeking employment.