Try This Team-Building Activity to Expand Data-Driven Management


Social services organizations use metrics such as attendance and engagement data for several reasons, including to inform program planning and execution and to fulfill funding and reporting requirements. Recently, a group of organizations that partnered with MDRC in the Strengthening the Implementation of Responsible Fatherhood Programs (SIRF) project used data analysis as part of a team-building effort—promoting equity by engaging diverse staff members in discussions about how to put such information to use. This post shares an exercise used by the organizations to inspire learning and reflection about how to improve referrals, service delivery, and engagement.
Team Activity Overview
The purpose of this activity is to gain familiarity with the data that track recruitment, referrals, and outreach efforts and how to draw observations and actions from aggregate reports that can be used to improve program management and operations strategies. To keep the exercise short, fun, and low stakes use simulated rather than real program data and offer multiple-choice answers to questions about the presented materials. There are no right or wrong answers. The point is to stimulate thoughtful discussion about the data and how it might be employed.
Below is an outline of the general approach program managers can use to set up these exercises as well as three examples of data program staff members have access to and the kinds of brainstorming that can take place. As you read the examples below, think about how you might adjust the questions or data to fit aspects of your own program.
Set Up
Gather Your Data and Identify Discussion Questions
- Gather three to five sets of data that your organization uses to track important outcomes.
- Aggregate the data into tables, graphs, or other creative visuals.
- Create a presentation slide deck with the data visuals and discussion questions.
- Focus discussion questions on three themes:
- Interrogate success: Find out what can be learned from the higher-performing aspects of your program that can be applied to the rest of the operation.
- Make micro and macro adjustments: Look beyond day-to-day operations and consider weekly or monthly operations to gain a new perspective on programmatic trends.
- Ask the “how” questions: Look for areas where quantitative data can be expanded upon to tell a larger story. Information in a chart or table encourages us to go from “what happened?” to “how did it happen?”
- Schedule time with your team to participate in the exercise and to debrief.
Introduce the Exercise
Set Ground Rules
- Assemble staff members and introduce the exercise.
- Establish ground rules with your group. The SIRF sites called this a “community agreement,” which helped teams to establish shared expectations and to encourage mutual respect, collaboration, and participation by all staff members.
- For each data set, present the slides with the data visuals and discussion questions, allow time for individual reflection, and then discuss as a group.
Project Example: Community Agreements
Run the Exercise
EXAMPLE 1: How are our referral partnerships?
Show data: Table 1. Referral Partner Recruitment Summary
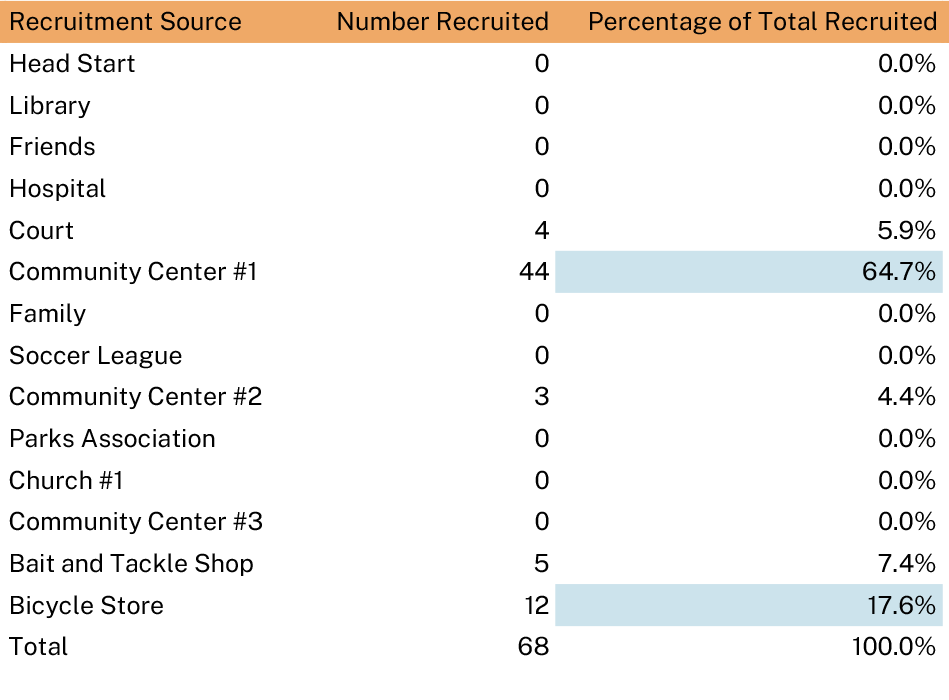
Describe the data: Table 1 presents an example of the kinds of recruitment data programs often track, showing the number of individuals recruited from each recruitment source. The data was recorded by staff members after asking applicants how they learned about the program.
Poll the group: What could be the next steps for the program?
- Talk to the partners with a high referral rate and learn more about what they are doing well.
- Reach out to the partners who have provided no referrals and discuss what challenges they are facing.
- Stop relations with programs with less than 10 referrals and let them know they are in a probation period.
Discuss: Reveal the results of the poll and discuss. For this example, the results might split across options 1 or 2. Option 3 was deliberately included as an extreme example to get staff members talking and thinking about community collaboration. The discussions that follow might also focus on the idea of “interrogating success,” which in this context means learning more about what made Community Center #1 or the Bicycle Store locations successful and applying those findings to other referral sources.
EXAMPLE 2: How are we delivering services to program participants?
Show data: Figure 1. Frequency of Coaching Techniques
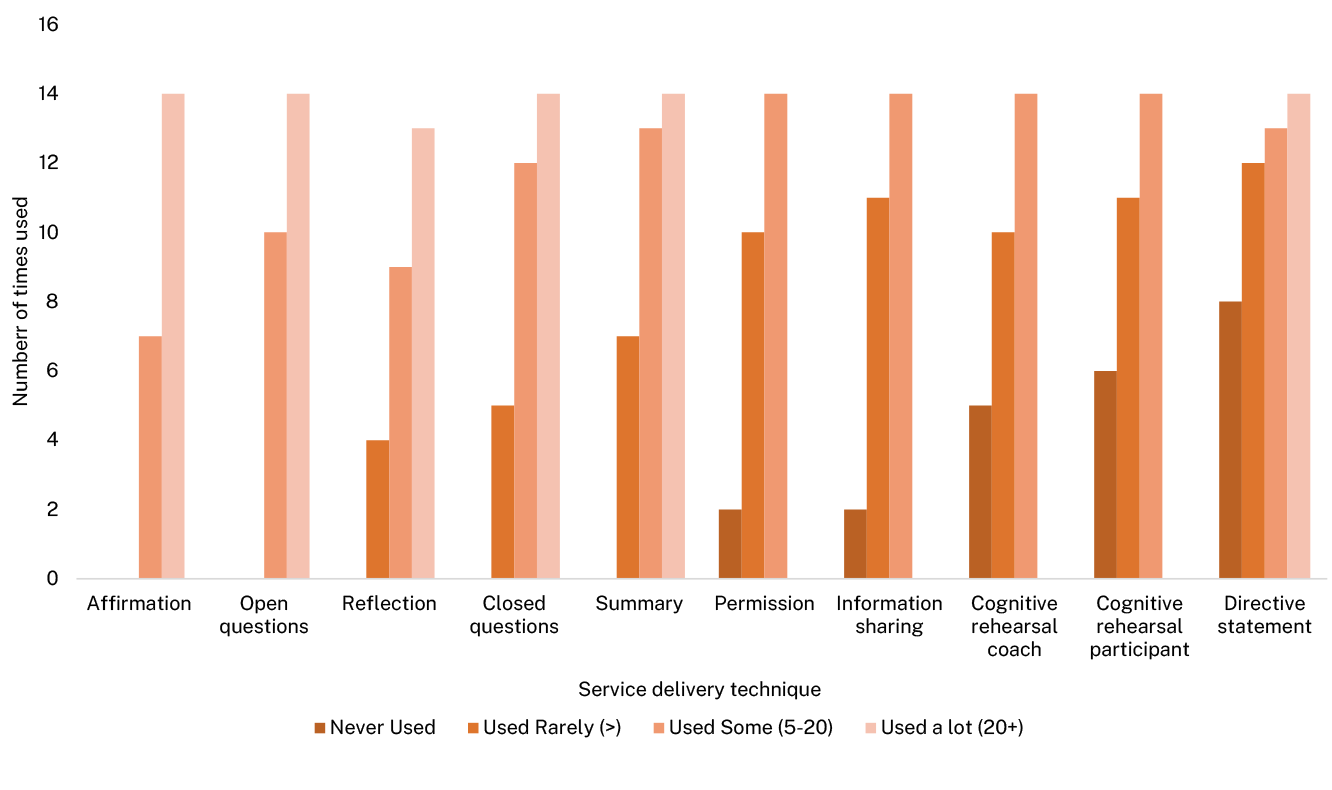
Describe the data: Figure 1 presents an example of the kinds of data staff members may collect about the techniques they use during one-on-one coaching sessions with program participants. The categories along the X axis represent techniques staff members have been trained to use as they deliver services. The Y axis and bar charts quantify how often the technique is used.
Poll the group: How might our program use this information to support our staff members in shifting from old practices (closed questions, directive statements) to new practices with coaching techniques (open questions, rehearsals)?
- Program managers could ask staff members to stop using affirmation, open questions, and reflection in the list of suggested techniques. There are already enough techniques without them.
- Program managers could reach out to staff members who never use directive statements or closed questions and find out why.
- Staff members are still using too many closed questions. Program managers should revisit the training provided to make sure it includes an emphasis on open questions.
Discuss: Reveal the results of the poll and discuss. For example, a discussion for this list of techniques might focus on the feasibility of the different approaches proposed. The first option—the removal of certain techniques—would be a big adjustment that could require more time and data to implement. The last option, a review of the training for staff members to tweak emphasis, is a smaller adjustment that would take less time to implement. Both could be effective, but the team would need to consider whether a light- or heavy-handed approach is more appropriate.
EXAMPLE 3: What are the most- and least-successful methods for reaching program participants?
Show data: Figure 2. Percentage of Contacts That Were Successful: Outreach Method
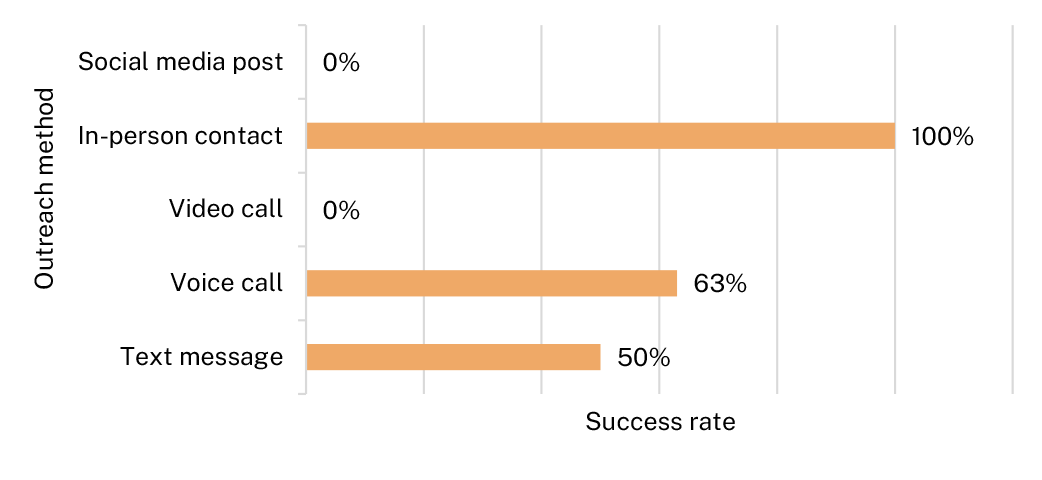
Describe the data: Figure 2 describes the methods that a staff member assigned to a new role at the office (a mentor) could use to reach out to program participants and how often the method results in a substantive contact with the participant. The Y axis describes the methods being used and the X axis reports the success rate.
Poll the group: What could be the next best step?
- Require all mentors to contact participants in person because it is the only method that is always successful.
- Have all mentors, as well as other staff members, stop using voice calls and start using video calls to balance out the data.
- Inquire further about the use of text messages and voice calls to see if there are any patterns in the more successful outreach methods.
Discuss: Reveal the results of the poll and discuss. Understanding the success rates of various outreach methods is useful in understanding your clients’ overall communication patterns, so mentors can stay in touch more effectively. The third example presents a comparison of the success rates of different outreach methods. The discussion for this set of suggestions might focus on the idea that data do not necessarily lead to conclusive answers. Oftentimes the most valuable part of looking back at your data is not finding answers but finding the right questions to ask. In this instance, for example, there are advantages and disadvantages to each outreach method, depending on the circumstances of the mentees. So, the “right question” is not which outreach method is most effective but rather what are the patterns of outreach success across the different methods. That line of inquiry could lead staff members to examine what distinguishes successful from unsuccessful text message and voice call outreach, to better understand how to connect with program participants.
Customize Your Approach
This kind of exercise can be helpful for any program that wants to improve the quality of services and has the capacity to dig into some data. By all means, adjust the sample data or charts to fit your particular field of work. Just keep the discussion focused on the themes mentioned above: interrogate success, make micro and macro adjustments, and ask the “how” questions.
The programs in the SIRF evaluation were able to use the data tools and analytical skills they applied in this workshop to adapt the frequency, modality, and outreach content of their interventions. Evaluating your own data and making programmatic decisions from these evaluations can help you make informed adjustments within or around the internal cycles of your program. This technique may ultimately strengthen your program’s ability to adapt to the ever-changing needs of the populations you work with.